Formatting Audit Data in Excel
Knowing Excel tips & tricks can save time and make the data analysis process easier. Here are some basic formatting tips which streamline the data analysis process following a building audit:
How to Format Columns:

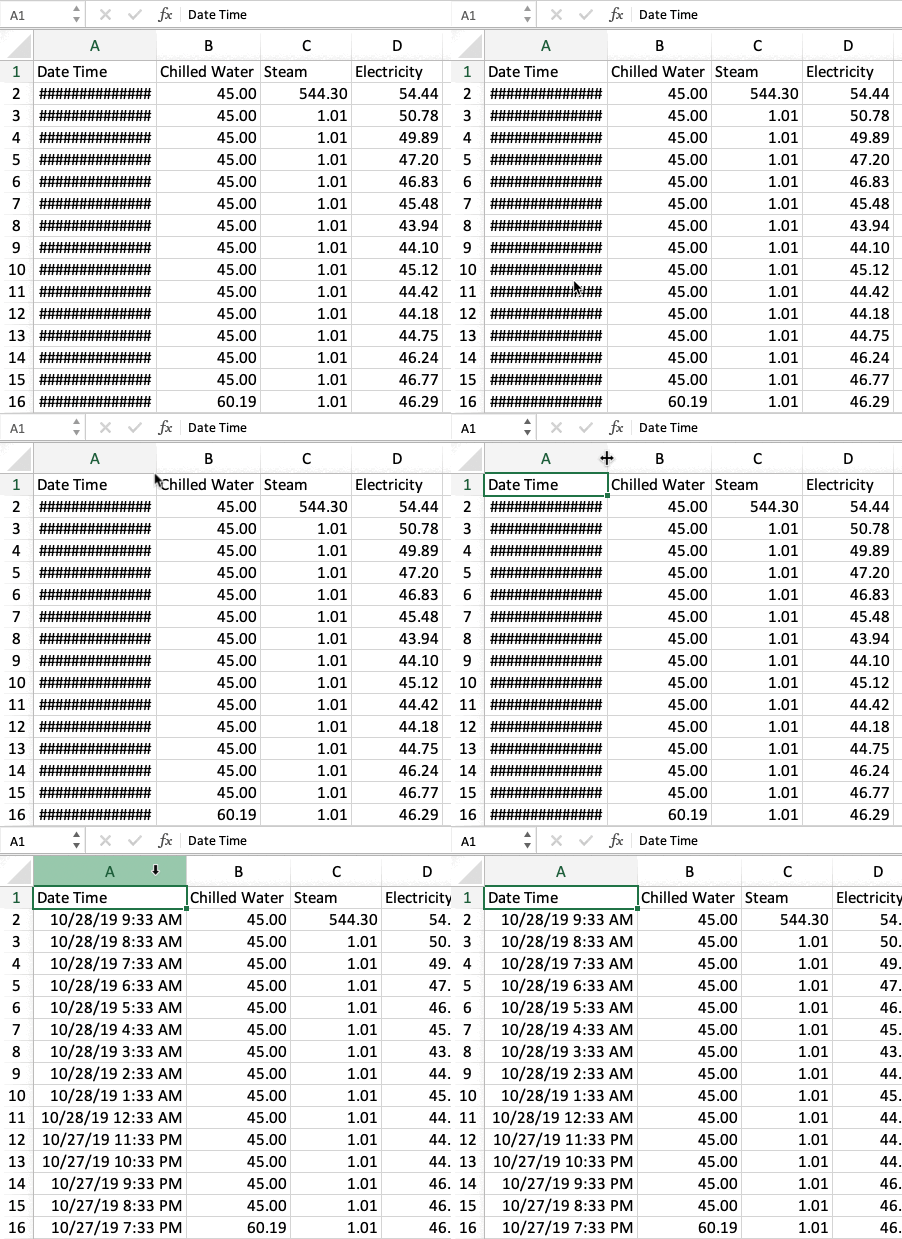
When your data looks like this (shown with the hashtags above) try dragging the columns with your cursor so that the data can be properly displayed by excel. Not making the columns a correct size is a simple, but easy error to make!
How to Copy Down:

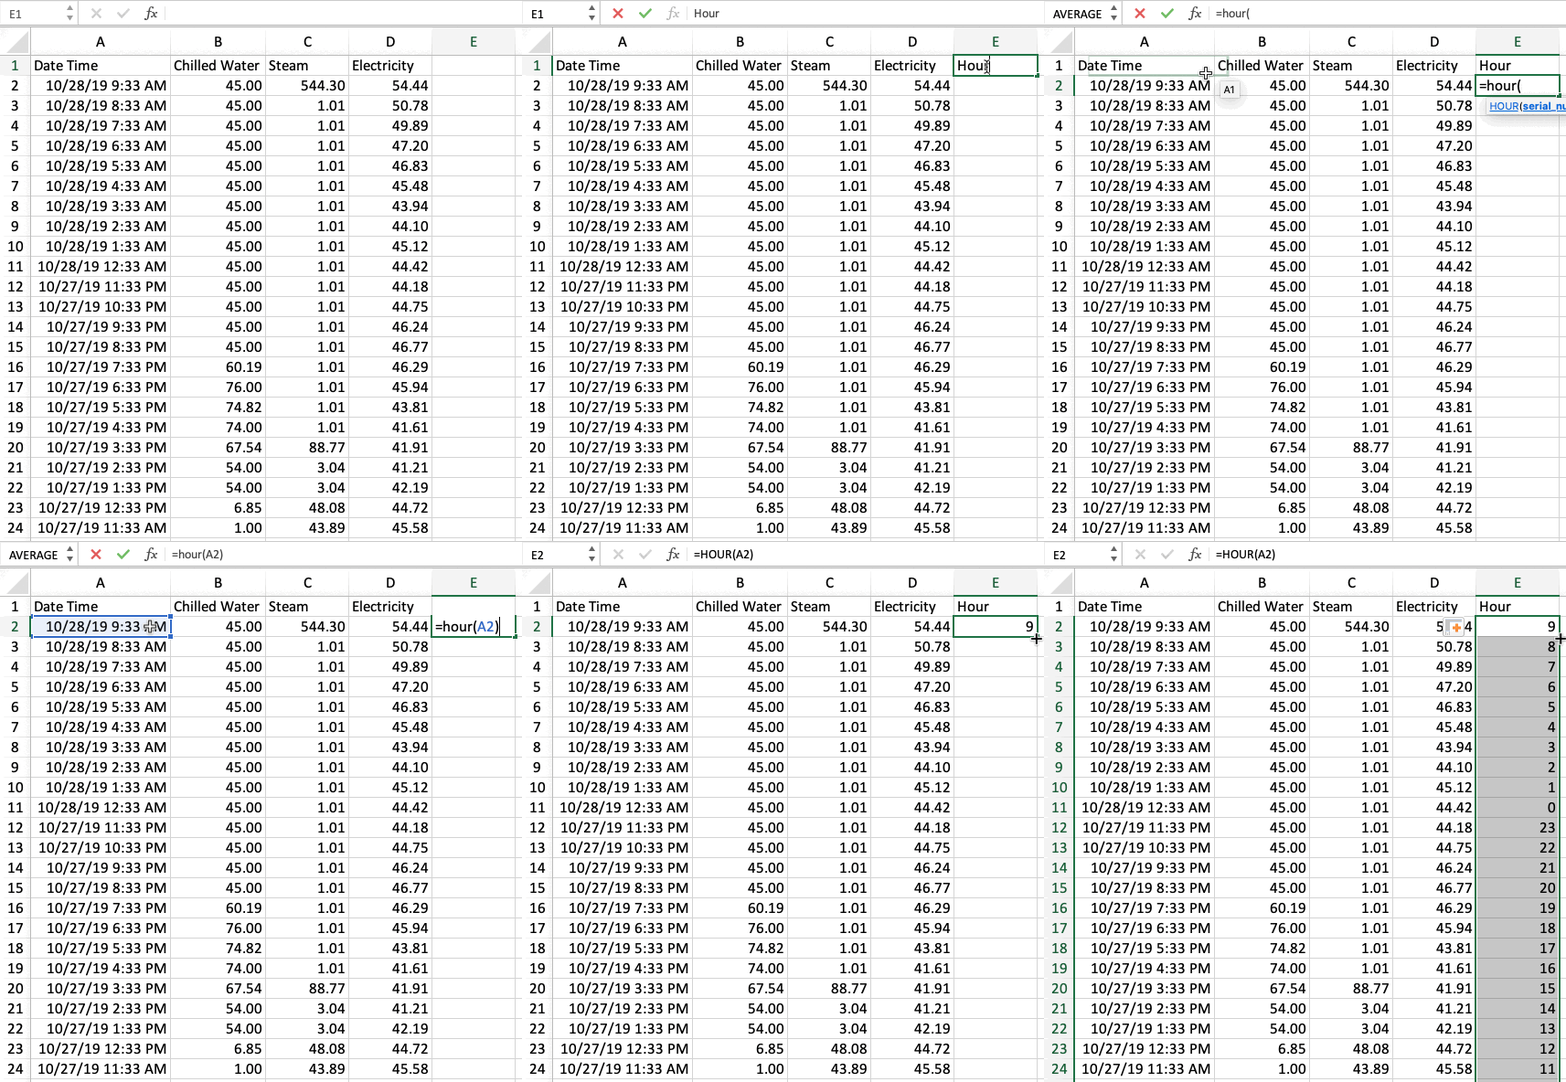
By using the copy down function, you can quickly copy and paste Excel formulas down the row instead of typing the formula over and over. After inputting the first formula, click the righthand corner of the first cell and drag down in order to apply the formula down all the rows. This will save a lot of time when dealing with large amounts of data!
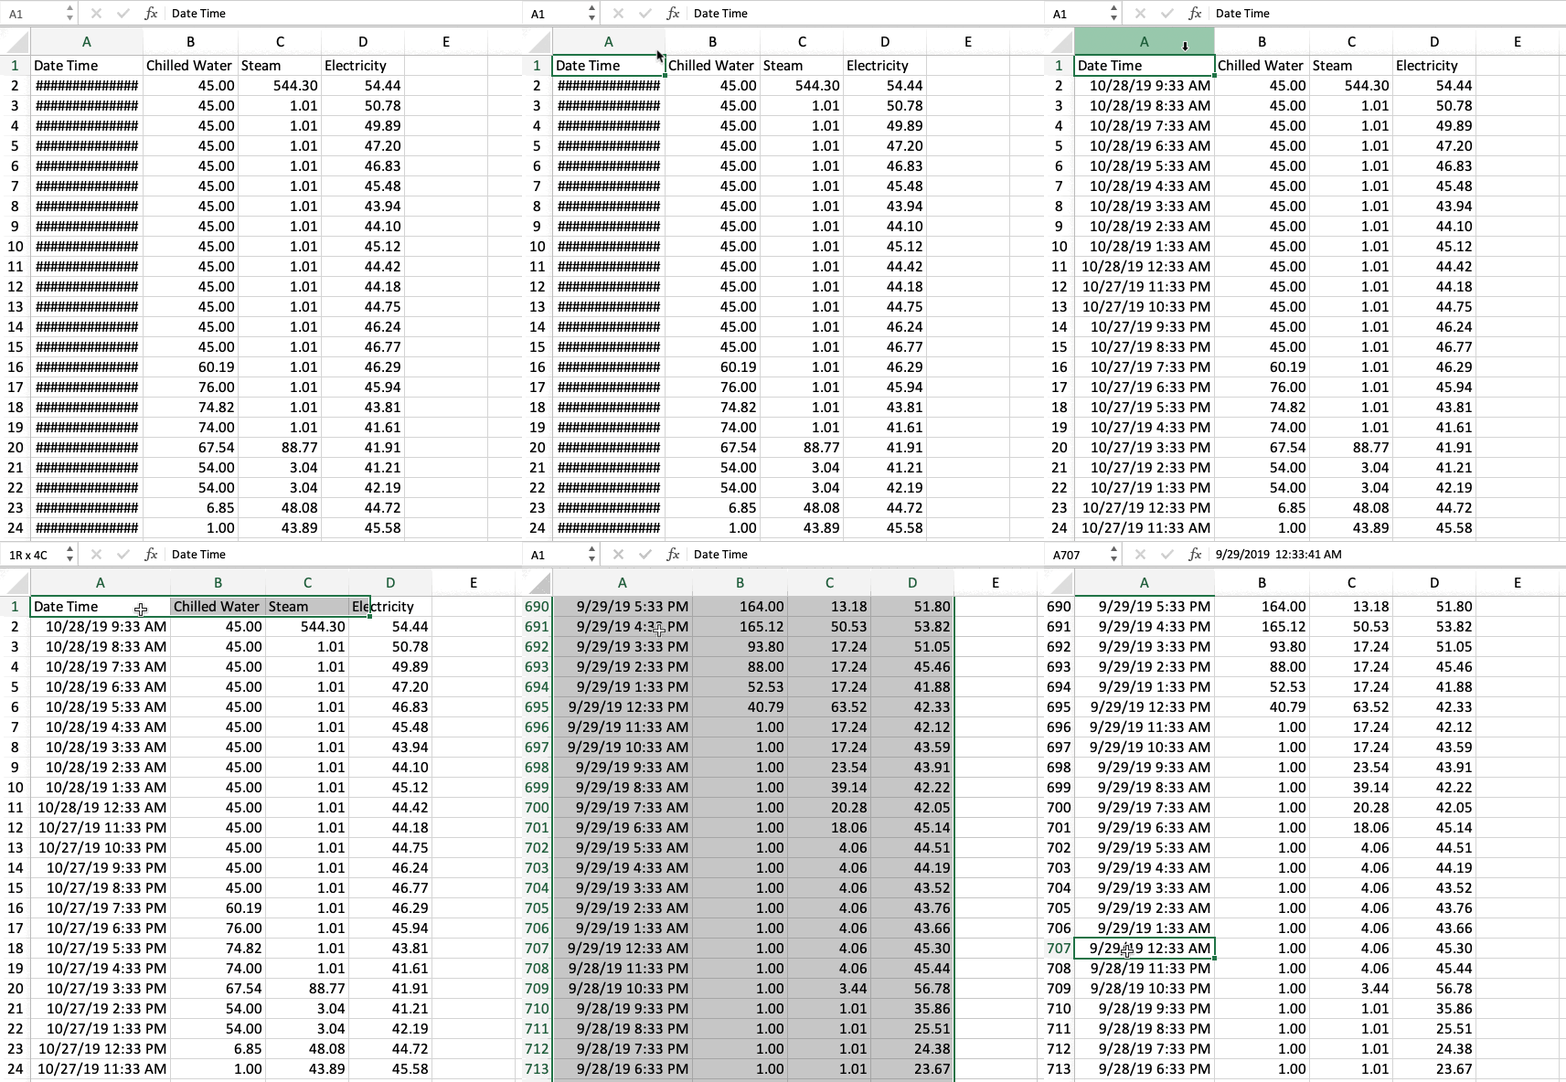
How to Expand Columns & Highlight:

How to Format an Axis:

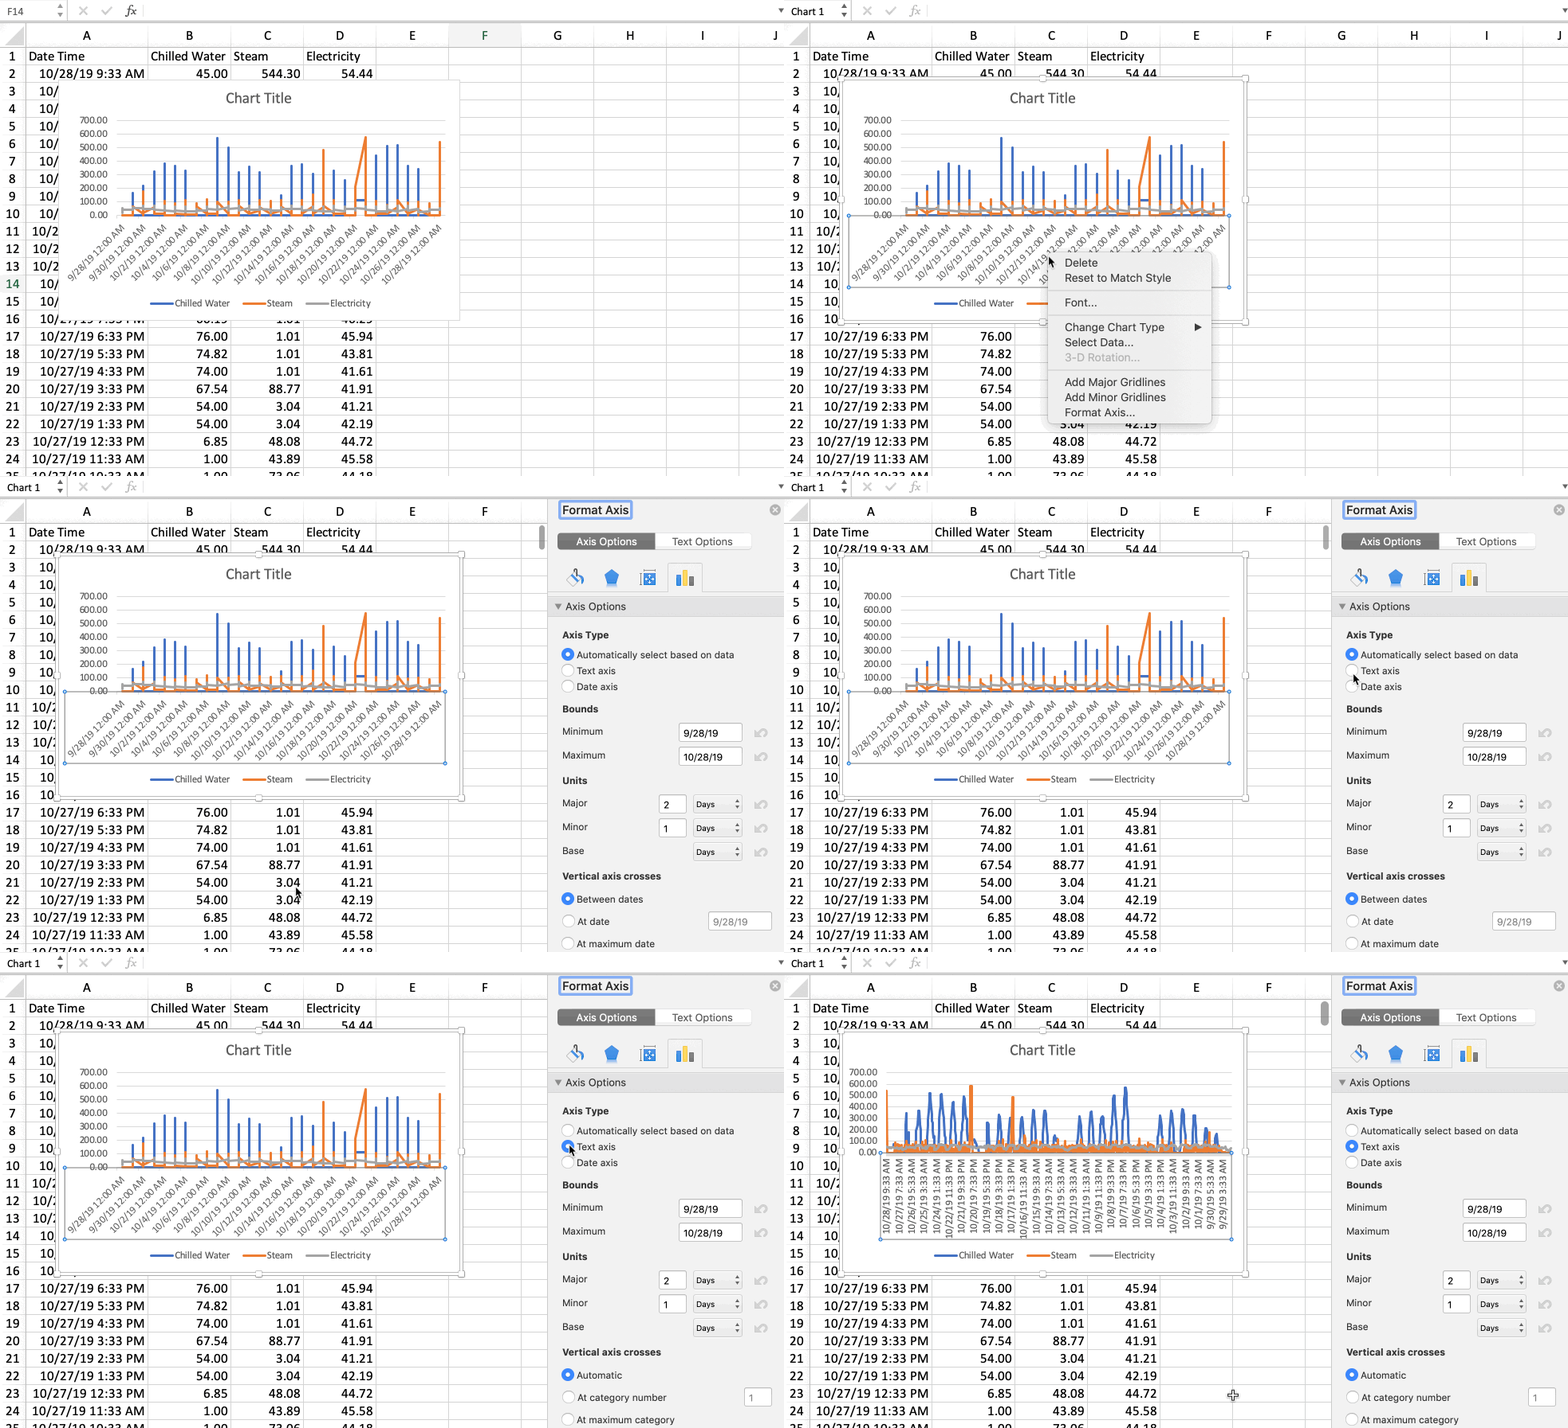
After right-clicking on the data set, click 'Format Axis' in order to adjust the appearance of your data. This will help you clean up your data so that it is clearly represented with the metrics you want to illustrate, and is useful for presenting your audit findings in the final audit report.